See what Prairie Power could do on your soybeans —
Grow EstimatorSee what Prairie Power could do on your soybeans —
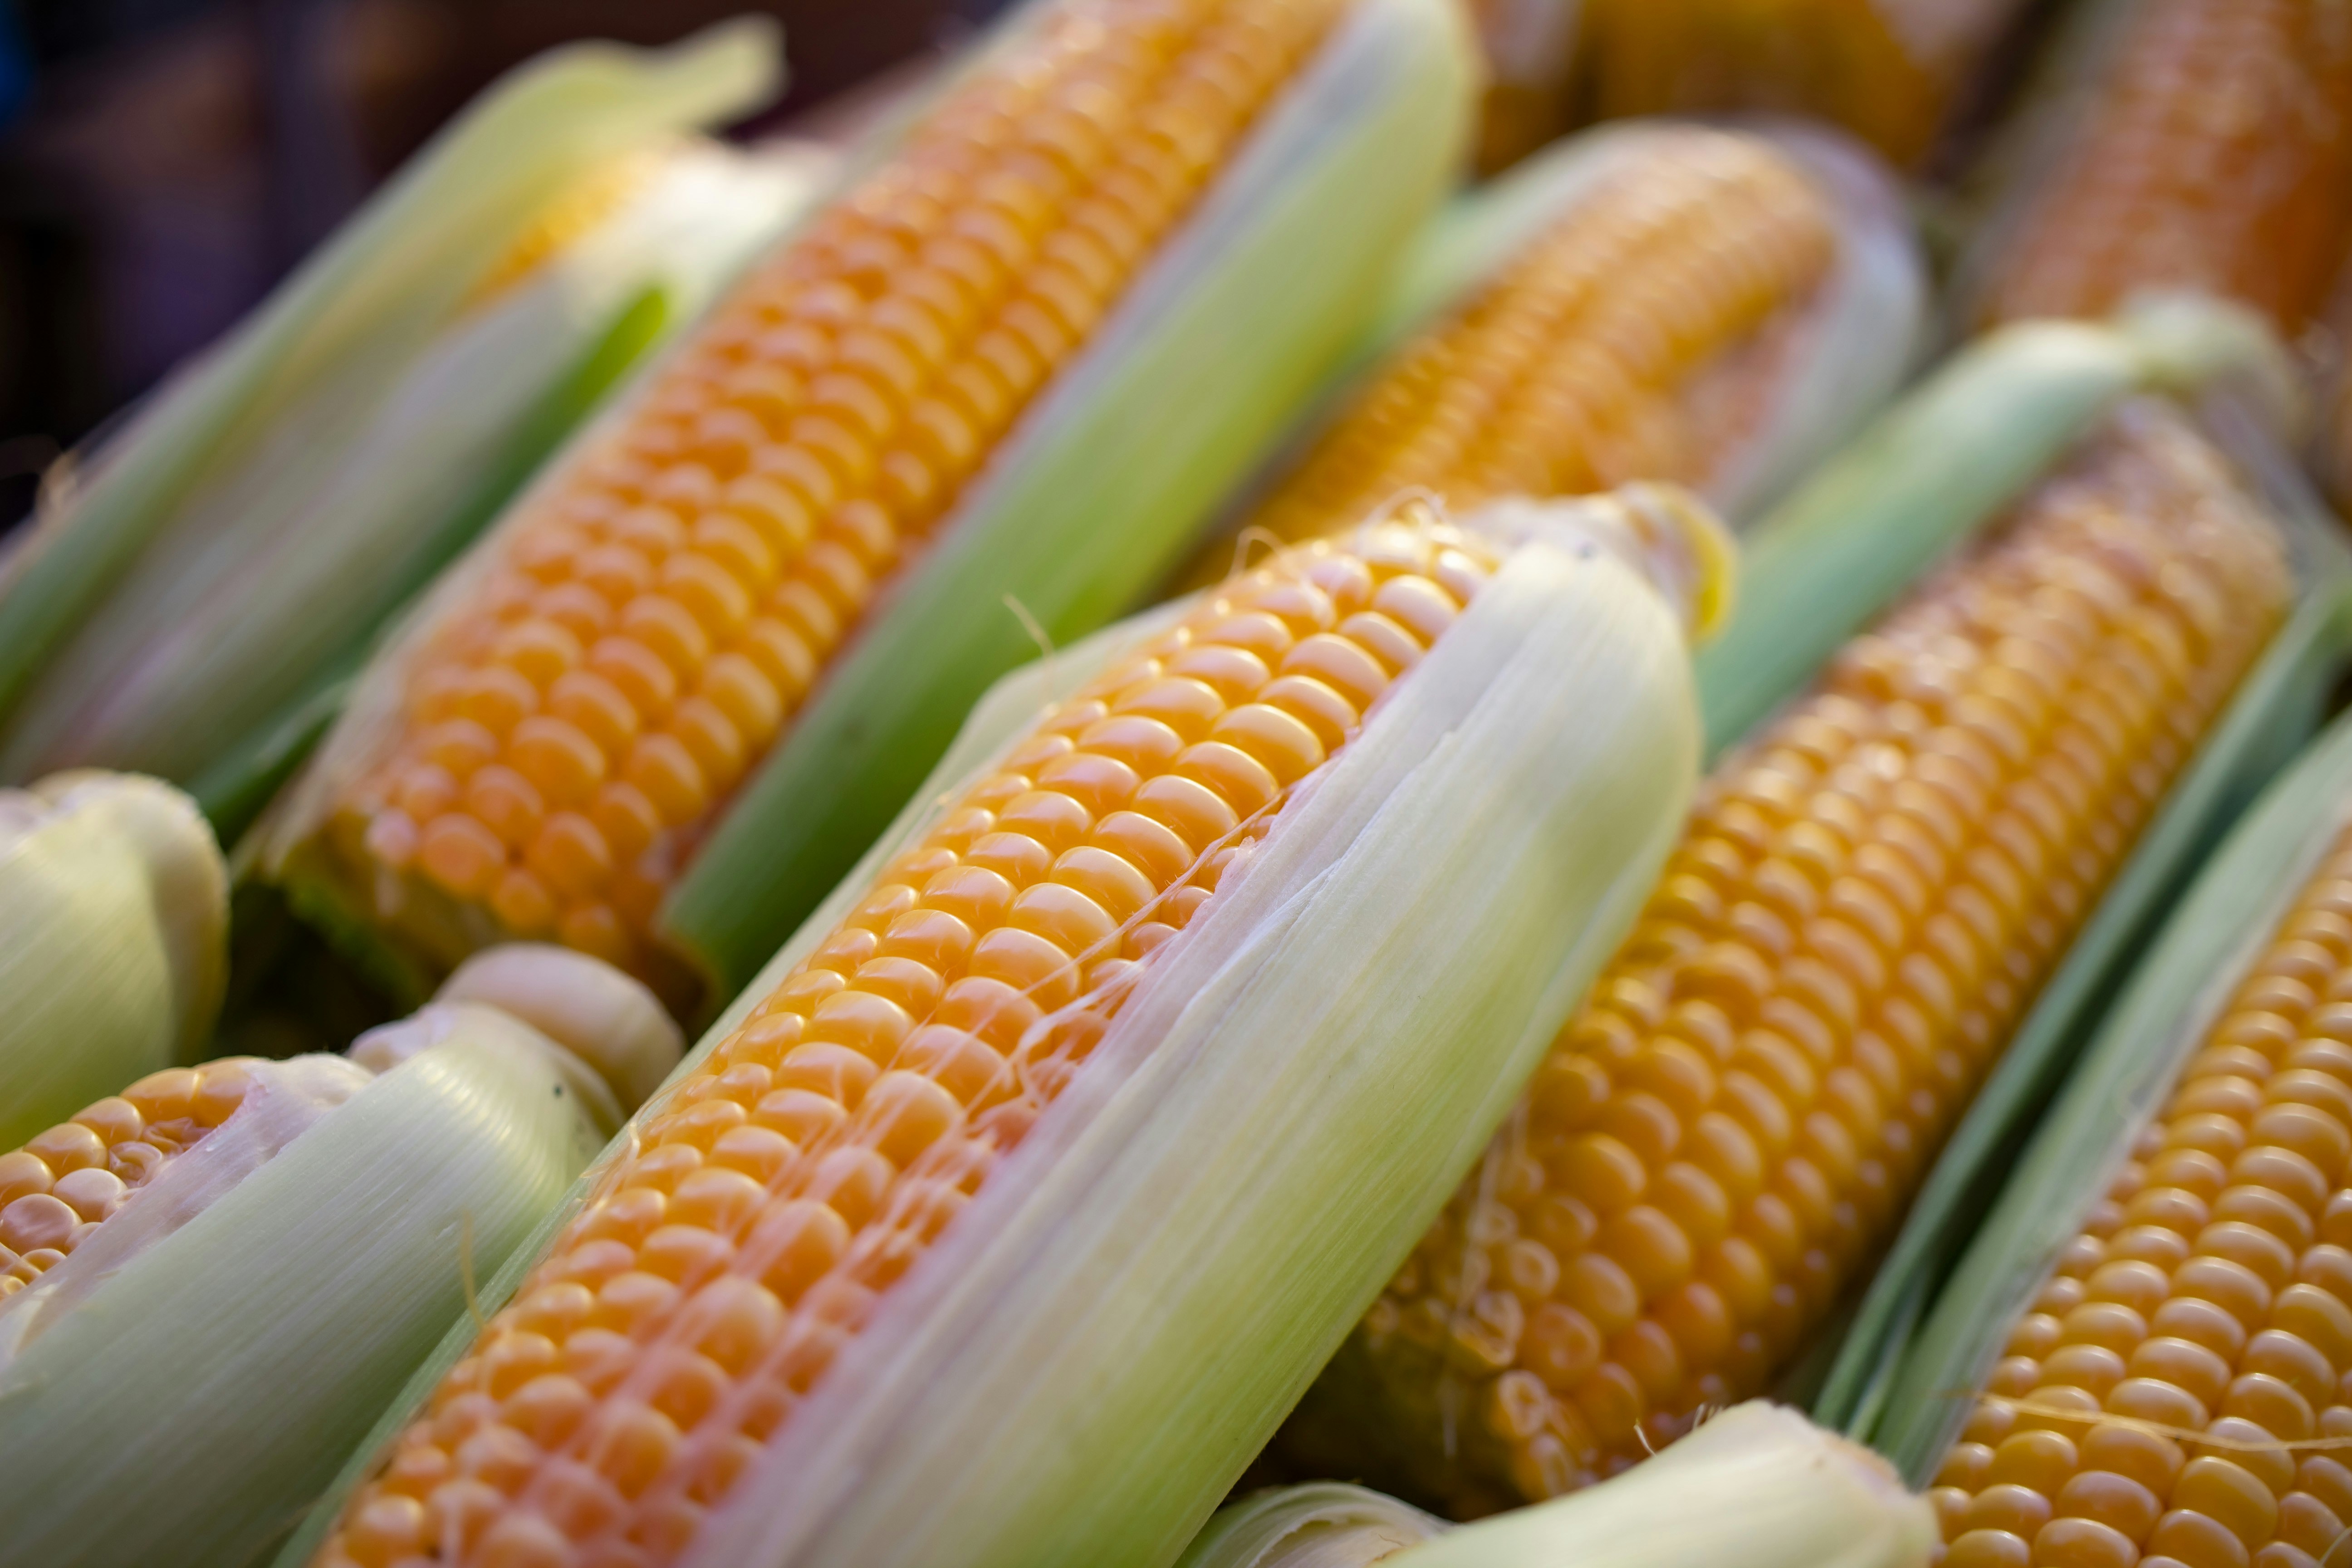
Grow EstimatorCorn Futures and Corn Prices:
What Every Row Crop Farmer Needs to Know

Earnest Agriculture
March 3, 2025